 The term NDVI in the agricultural industry has certainly gained more awareness lately thanks to the growing popularity of small unmanned aerial vehicles.
NDVI is certainly not a new kid on the block and when it comes to gathering and processing this information, agricultural professionals have known and been using this data for years. However previously gathering this data may have been time-consuming, cumbersome, not very accurate and expensive.
As technology improves and the means in which we can now capture this data, agriculturists are starting to take this simple and effective data more seriously by looking to incorporate this method into their crop management strategy.
Data is key in precision agriculture, knowing your crop’s health is one thing but actually pre-empting the condition of crop’s health, prescribing fertiliser application, identify any potential disease and accurately estimating yield puts the control in your hands thus making you well informed to make the right business decisions as and when required.
So what actually is NDVI? What does it mean and more importantly how do we make decisions based on this information? Let’s take a closer look…
What is NDVI?
 Sounds technical, doesn’t it? However, it is actually quite straightforward. NDVI stands for Normalized Difference Vegetation Index and it is simply the sum of the reflectivity of near-infrared light subtracted from the reflectivity of the red light. This is then divided by the sum of the reflectivity of near-infrared light plus the reflectivity of the red light.
For the guys who need a visual…
NDVI=(NIR-RED)/(NIR+RED)
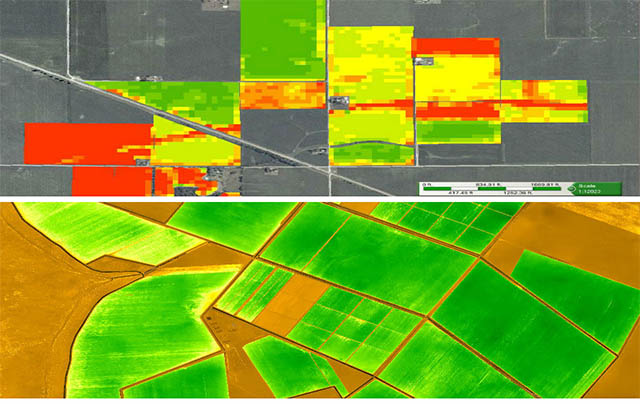
So why does this formula produce the data we are after? This formula was constructed based on the basic principle that plants reflect a lot of light in the near infrared band where most non-plant objects do not reflect this light…. the key to all this! When plants become dehydrated or stressed they reflect less near-infrared light, but the same amount in the visible range. When we combine these two types of information we can then visually differentiate not only between what is plant and non-plant but also which are healthy and unhealthy.
How to Gather NDVI Data
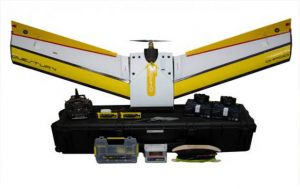
 They are many ways in which we can capture this data ranging from simple hand-held cameras to satellite imagery. All these have their pros and cons but by far the best way to retrieve the highest quality and accurate results is to use an unmanned aerial vehicle (UAV). This gives you the best coverage, resolution and accuracy.
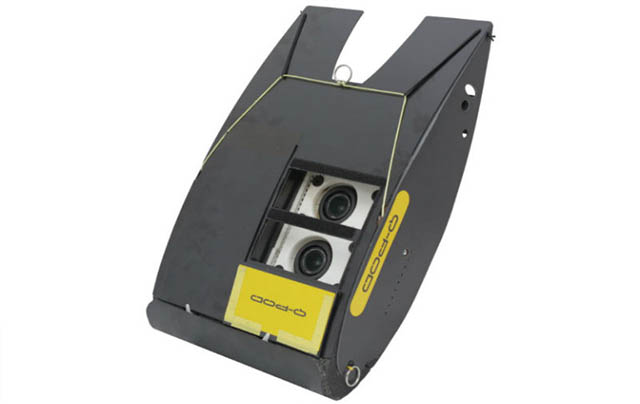
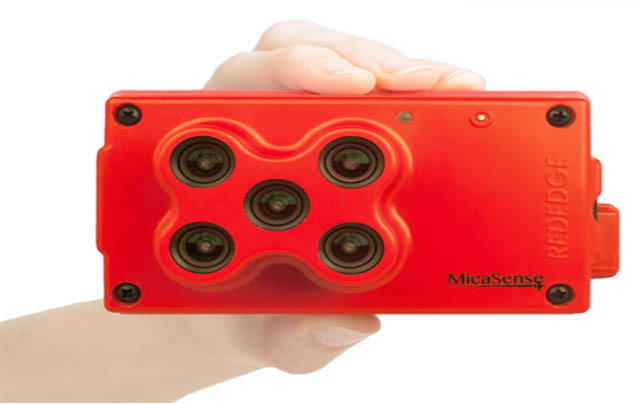
The UAV is equipped with two highly sensitive sensors. One near infrared sensor (NIR) and one visible sensor (red, green blue channels).
The UAVs flight path is pre-programmed (via flight mission software) beforehand ensuring the best area coverage, suitable imagery overlap and resolution is taken into account. This flight path (or mission) is loaded into the UAVs autopilot system which will fully autonomously fly the UAV over this flight path and trigger the sensors at either predetermined time intervals, distance travelled or GPS coordinates.
How to Process NDVI Data
 Once the mission is completed and all imagery is captured, the data is then taken from the UAV and imported into post-processing software.
There are currently many post-processing solutions, however, QuestUAV recommend Pix4dMapper. Both sets of data (NIR and RGB) are imported into the processing software and from there we can amalgamate all imagery into one piece, this is known as a 2D photo mosaic. From here we can extract the vital NDVI data.
Here is a quick overview process of importing the data, generating the 2D photo mosaic and extracting the NDVI data.
QuestUAV currently offers a full agriculture package that covers every stage of the mapping process. The Q200 Agri Pro now also comes in an Agri Pro Lite version making it even more affordable to start gathering NDVI data to ensure you are making well informed agricultural decisions.
